Adding images to Plotly
Plotly, JavaScript
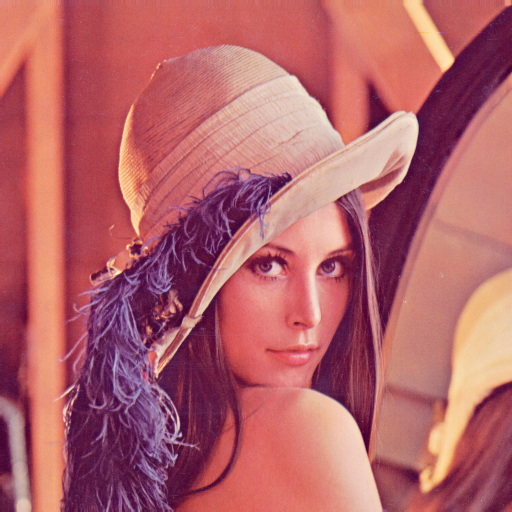
Below is a simple example of an image embedded in a Plotly plot.
Embedding Images in Plotly
Let’s break down the process of embedding an image into a Plotly visualization step by step. The complete solution involves several key components:
Setting Up the HTML Structure
First, we need a basic HTML structure with the necessary elements:
<!DOCTYPE html>
<html lang="en">
<head>
    <script src="https://cdn.plot.ly/plotly-2.2.0.min.js"></script>
    <meta charset="UTF-8">
    <meta name="viewport" content="width=device-width, initial-scale=1.0">
    <title>Grayscale Image Visualization</title>
    <style>
        body { margin: 0; padding: 0; }
        #myDiv { width: 100%; height: 90vh; }
    </style>
</head>
<body>
    <!-- Hidden image element that will be processed -->
    <img id="sourceImage" src="https://upload.wikimedia.org/wikipedia/en/7/7d/Lenna_%28test_image%29.png"
         style="display:none;" crossorigin="anonymous" onload="app.init()">

    <!-- Container for the Plotly visualization -->
    <div id="myDiv"></div>

 <!--
      /*
      * This section will contain:
      * - Image upload functionality
      * - Additional visualization options
      */
  -->

</body>
</html>
The key elements here are: - Loading the Plotly.js library - Creating a hidden <img> element with the source image - Adding a container div for the visualization - Setting up the onload event to initialize our app
Defining the Application Structure
Next, we create an application object to organize our code:
const app = {
    // Configuration options
    grayscaleWeights: {
        red: 0.2989,
        green: 0.5870,
        blue: 0.1140
    },

    colorScale: [
        [0.0, 'rgb(0, 0, 0)'], [0.05, 'rgb(13, 13, 13)'],
        // ... additional color scale entries ...
        [0.95, 'rgb(249, 249, 249)'], [1.0, 'rgb(255, 255, 255)']
    ],

    // State variables
    imageData: null,

    // Application methods will be defined here
};
This object contains: - Configuration parameters for grayscale conversion - A custom grayscale color scale for Plotly - State variables to hold processed data
Initializing the Application
The initialization function sets up our workflow:
init() {
    this.processImage()
        .then(() => this.renderPlot())
        .catch(err => console.error('Error initializing app:', err));
}
This method: 1. Processes the image to extract grayscale data 2. Renders the Plotly visualization when processing is complete 3. Includes error handling for robustness
Processing the Image
The image processing is where we convert a color image to grayscale data:
async processImage() {
    try {
        const img = document.getElementById('sourceImage');
        const canvas = document.createElement('canvas');
        const ctx = canvas.getContext('2d');

        // Set canvas dimensions to match image
        canvas.width = img.naturalWidth;
        canvas.height = img.naturalHeight;

        // Draw image to canvas
        ctx.drawImage(img, 0, 0);

        // Get raw pixel data
        const rawImageData = ctx.getImageData(0, 0, canvas.width, canvas.height);
        const pixelData = rawImageData.data;

        // Convert to grayscale array
        const width = canvas.width;
        const height = canvas.height;
        const grayscaleData = Array(width).fill().map(() => Array(height).fill(0));

        for (let x = 0; x < width; x++) {
            for (let y = 0; y < height; y++) {
                const idx = (y * width + x) * 4;
                const r = pixelData[idx] / 255;
                const g = pixelData[idx + 1] / 255;
                const b = pixelData[idx + 2] / 255;

                // Apply weights to convert to grayscale
                grayscaleData[x][y] = this.grayscaleWeights.red * r +
                                     this.grayscaleWeights.green * g +
                                     this.grayscaleWeights.blue * b;
            }
        }

        // Transform array to match desired orientation
        this.imageData = this.transformArray(grayscaleData);
    } catch (error) {
        console.error('Image processing error:', error);
        throw error;
    }
}
This method: 1. Uses a hidden canvas to access the image data 2. Extracts raw pixel values from the image 3. Converts RGB values to grayscale using industry-standard weights 4. Stores the processed data in a 2D array
Transforming the Data
The transform function ensures our data has the right orientation:
transformArray(array) {
    const width = array.length;
    const height = array[0].length;
    const newArray = Array(height).fill().map(() => Array(width).fill(0));

    for (let x = 0; x < width; x++) {
        for (let y = 0; y < height; y++) {
            newArray[y][width - x - 1] = array[x][y];
        }
    }
    return newArray;
}
This method: 1. Flips and rotates the data to match the expected orientation 2. Returns a new array with the transformed values
Rendering with Plotly
Finally, we render the visualization using Plotly’s surface plot:
renderPlot() {
    const width = this.imageData.length;
    const height = this.imageData[0].length;

    // Create coordinate arrays
    const xValues = Array.from({length: width}, (_, i) => i);
    const yValues = Array.from({length: height}, (_, i) => i);

    // Create z-values (flat surface)
    const zValues = Array(width).fill().map(() => Array(height).fill(0));

    // Create surface plot
    const surfacePlot = {
        x: xValues,
        y: yValues,
        z: zValues,
        type: 'surface',
        showscale: false,
        surfacecolor: this.imageData,
        colorscale: this.colorScale,
    };

    const layout = {
        scene: {
            aspectratio: {x: 1, y: 1, z: 0.5},
            camera: {eye: {x: 1.5, y: 1.5, z: 1.5}},
            bgcolor: 'rgba(0,0,0,0)'
        },
        paper_bgcolor: 'rgba(0,0,0,0)',
        plot_bgcolor: 'rgba(0,0,0,0)',
        margin: {l: 0, r: 0, t: 0, b: 0}
    };

    Plotly.newPlot('myDiv', [surfacePlot], layout);
}
This method: 1. Creates coordinate arrays for the x and y axes 2. Sets up a flat surface with z-values of 0 3. Uses our grayscale data for the surface color 4. Configures a transparent background 5. Renders the final visualization with Plotly
Putting It All Together
To complete our application, we initialize it when the image loads:
<img id="sourceImage" src="image-url.png"
     style="display:none;" crossorigin="anonymous" onload="app.init()">
The onload event ensures our code runs after the image is fully loaded.
The Key Insight
The most important part of this technique is using Plotly’s surfacecolor property rather than the z-values to represent the image data. This allows us to:
- Keep the surface geometrically flat (all z=0)
- Use the grayscale intensity to determine the color at each point
- Create a visually intuitive representation of the image data
This approach can be extended to other types of data visualization where you want to separate the geometric shape from the color mapping.
Full Code
Here is the full code for the example:
<!DOCTYPE html>
<html lang="en">
<head>
    <script src="https://cdn.plot.ly/plotly-2.2.0.min.js"></script>
    <meta charset="UTF-8">
    <meta name="viewport" content="width=device-width, initial-scale=1.0">
    <title>Grayscale Image Visualization</title>
    <style>
        body { margin: 0; padding: 0; }
        #myDiv { width: 100%; height: 90vh; }
    </style>
</head>
<body>
    <img id="sourceImage" src="https://tetraquark.vercel.app/posts/imageinplotly/Lenna.png"
         style="display:none;" crossorigin="anonymous" onload="app.init()">
    <div id="myDiv"></div>

    <script>
    const app = {
        // Configuration
        grayscaleWeights: {
            red: 0.2989,
            green: 0.5870,
            blue: 0.1140
        },

        colorScale: [
            [0.0, 'rgb(0, 0, 0)'], [0.05, 'rgb(13, 13, 13)'], [0.1, 'rgb(29, 29, 29)'],
            [0.15, 'rgb(45, 45, 45)'], [0.2, 'rgb(64, 64, 64)'], [0.25, 'rgb(82, 82, 82)'],
            [0.3, 'rgb(94, 94, 94)'], [0.35, 'rgb(108, 108, 108)'], [0.4, 'rgb(122, 122, 122)'],
            [0.45, 'rgb(136, 136, 136)'], [0.5, 'rgb(150, 150, 150)'], [0.55, 'rgb(165, 165, 165)'],
            [0.6, 'rgb(181, 181, 181)'], [0.65, 'rgb(194, 194, 194)'], [0.7, 'rgb(206, 206, 206)'],
            [0.75, 'rgb(217, 217, 217)'], [0.8, 'rgb(226, 226, 226)'], [0.85, 'rgb(235, 235, 235)'],
            [0.9, 'rgb(243, 243, 243)'], [0.95, 'rgb(249, 249, 249)'], [1.0, 'rgb(255, 255, 255)']
        ],

        // State
        imageData: null,

        // Initialize application
        init() {
            this.processImage()
                .then(() => this.renderPlot())
                .catch(err => console.error('Error initializing app:', err));
        },

        // Process image to grayscale data
        async processImage() {
            try {
                const img = document.getElementById('sourceImage');
                const canvas = document.createElement('canvas');
                const ctx = canvas.getContext('2d');

                canvas.width = img.naturalWidth;
                canvas.height = img.naturalHeight;
                ctx.drawImage(img, 0, 0);

                const rawImageData = ctx.getImageData(0, 0, canvas.width, canvas.height);
                const pixelData = rawImageData.data;

                // Convert to grayscale array
                const width = canvas.width;
                const height = canvas.height;
                const grayscaleData = Array(width).fill().map(() => Array(height).fill(0));

                for (let x = 0; x < width; x++) {
                    for (let y = 0; y < height; y++) {
                        const idx = (y * width + x) * 4;
                        const r = pixelData[idx] / 255;
                        const g = pixelData[idx + 1] / 255;
                        const b = pixelData[idx + 2] / 255;

                        grayscaleData[x][y] = this.grayscaleWeights.red * r +
                                             this.grayscaleWeights.green * g +
                                             this.grayscaleWeights.blue * b;
                    }
                }

                // Match R script orientation
                this.imageData = this.transformArray(grayscaleData);
            } catch (error) {
                console.error('Image processing error:', error);
                throw error;
            }
        },

        // Transform array to match R orientation
        transformArray(array) {
            const width = array.length;
            const height = array[0].length;
            const newArray = Array(height).fill().map(() => Array(width).fill(0));

            for (let x = 0; x < width; x++) {
                for (let y = 0; y < height; y++) {
                    newArray[y][width - x - 1] = array[x][y];
                }
            }
            return newArray;
        },

        // Render the 3D plot
        renderPlot() {
            const width = this.imageData.length;
            const height = this.imageData[0].length;

            // Create coordinate arrays
            const xValues = Array.from({length: width}, (_, i) => i);
            const yValues = Array.from({length: height}, (_, i) => i);

            // Create z-values (flat surface)
            const zValues = Array(width).fill().map(() => Array(height).fill(0));

            // Create surface plot
            const surfacePlot = {
                x: xValues,
                y: yValues,
                z: zValues,
                type: 'surface',
                showscale: false,
                surfacecolor: this.imageData,
                colorscale: this.colorScale
            };

            const layout = {
            scene: {
                aspectratio: {x: 1, y: 1, z: 0.5},
                camera: {eye: {x: 1.5, y: 1.5, z: 1.5}},
                bgcolor: 'rgba(0,0,0,0)'
            },
            paper_bgcolor: 'rgba(0,0,0,0)',
            plot_bgcolor: 'rgba(0,0,0,0)',
            margin: {l: 0, r: 0, t: 0, b: 0}
        };
            Plotly.newPlot('myDiv', [surfacePlot], layout);
        }
    };
    </script>
</body>
</html>